Học tiếng Anh: Mô tả biểu đồ trong bài IELTS Writing Task 1 thế nào cho “sang"?
(Dân trí) - Trong bài IELTS Writing Task 1, bạn sẽ được yêu cầu phân tích 1-2 biểu đồ bằng một bài viết có độ dài tối thiểu 150 từ. Đối với những biểu đồ có mốc thời gian, bạn cần phải mô tả chính xác sự thay đổi của số liệu qua từng thời điểm. Để tránh nỗi ám ảnh “bí từ" trong bài thi, hãy ghi nhớ ngay các từ/cụm từ mô tả xu hướng (tăng lên - giảm xuống - giữ nguyên) sau nhé!
Trắc nghiệm kiến thức: Hãy lựa chọn đáp án đúng trong số các cụm từ cho sẵn dưới đây để điền vào chỗ trống.
reached a peak | a steady downward trend | a marked increase |
more popular | a sharp decline | a significant decrease |
a significant rise | exceeded |
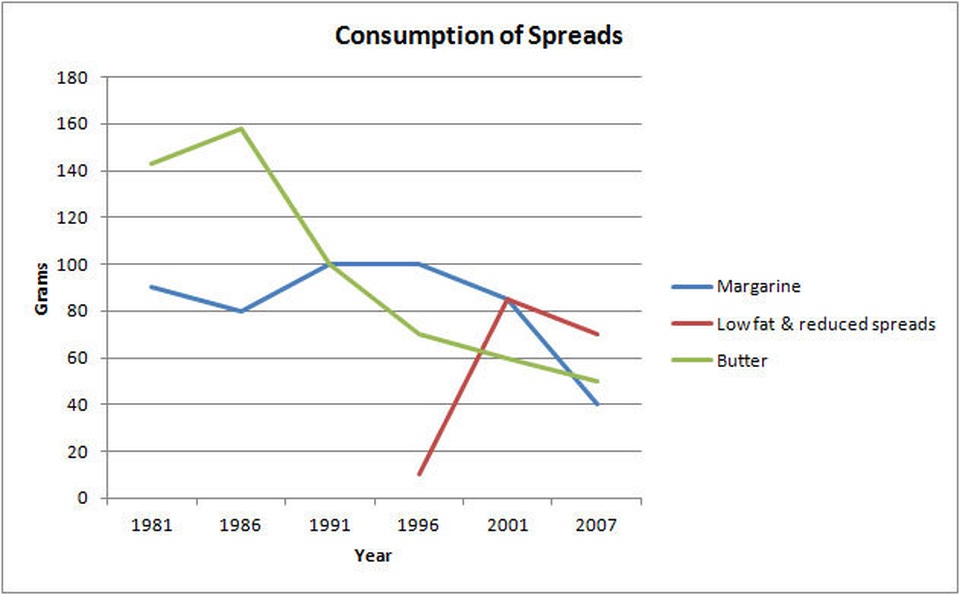
You should spend about 20 minutes on this task. The line graph illustrates the amount of spreads consumed from 1981 to 2007, in grams. Summarize the information by selecting and reporting the main features and make comparisons where relevant. Write at least 150 words. |

The graph shows the quantity of margarine, low fat spreads and butter consumed between 1981 and 2007. The quantities are measured in grams. Over the period 1981 to 2007 as a whole, there was (1) _____ in the consumption of butter and margarine and (2) _____ in the consumption of low-fat spreads.
Butter was the most popular fat at the beginning of the period, and consumption (3) _____ of about 160 grams in 1986. After this, there was (4) ______.
The consumption of margarine began lower than that for butter at 90 grams. Following this, in 1991, it (5) _____ that of butter for the first time, but after 1996 there was (6) _____ in the amount consumed, which seemed set to continue.
Low–fat spreads were introduced in 1996, and they saw (7) _____ in their consumption from that time, so that by about 2001 they were (8) _____ than either butter or margarine.
Đáp án xem TẠI ĐÂY
Nhật Hồng (nguồn JOLO English)


